

Q3 2022 Market Commentary
September Sell-Off Caps Challenging Quarter

Equity markets saw widespread declines in September, bringing the major indices to their lowest closing levels for the year. The S&P 500 fell 9.21 percent during the month and 4.88 percent during the quarter; the DJIA fell 8.76 percent for the month and 6.17 percent for the quarter; and the Nasdaq Composite fell 10.44 percent for the month and 3.91 percent for the quarter.
Per Bloomberg Intelligence, as of September 16, 2022, with 99.8 percent of companies having reported actual earnings, the blended earnings growth rate for the S&P 500 in the second quarter was 8 percent. This is up notably from the estimates for 4.1 percent earnings growth at the start of earnings season.
While fundamentals were supportive during the quarter, technical factors were another story. All three major U.S. indices finished the month well below their respective 200-day moving averages for the sixth consecutive month.
Internationally, technicals were challenging. The MSCI EAFE Index lost 9.35 percent in September and 9.36 percent during the quarter. The MSCI Emerging Markets Index dropped 11.67 percent for the month and 11.42 percent for the quarter. Both indices finished September below their respective 200-day moving averages (as has been true every month this year).
Fixed income markets also experienced widespread declines due to rising interest rates. The 10-year Treasury yield rose from 2.98 percent in the second quarter to 3.83 percent in the third quarter, bringing long-term rates well above pre-Covid-19 pandemic levels.
The 2-year Treasury yield increased from 2.92 percent in the second quarter to 4.22 percent in September. Rising rates were driven by expectations for higher short-term interest rates from the Federal Reserve (Fed) this year and into 2023. The Bloomberg Aggregate Bond Index declined 4.32 percent for the month and 4.75 percent for the quarter.
High-yield fixed income also experienced sell-offs. The Bloomberg U.S. Corporate High Yield Index dropped 3.97 percent for the month and 0.65 percent for the quarter due to the rising rate environment and widening credit spreads in September. Spreads, however, finished the quarter largely unchanged.
Rising Rates Pressure Investors
Third-quarter market turbulence was primarily driven by rising interest rates, caused by increased investor expectations for higher short-term rates. The Fed hiked the federal funds rate a combined 150 basis points (bps) at its July and September meetings to slow economic growth and combat inflation, and more rate hikes are expected at the upcoming November and December meetings.
Long-term interest rates have been muted—the 10-year Treasury yield spent most of the post-crisis period below 3 percent—and the recent increase rattled markets. While this year’s rate increases and market volatility have served as a headwind, there are signs that the worst impact may be behind us.
Economic Growth Continues Despite Housing Slowdown
Housing performed well in 2020 and 2021, but rising mortgage rates and home prices have contributed to a sharp slowdown this year. The annual pace of existing homes sales fell to their lowest level in August since 2020. The pace of existing home sales peaked in January at a rate of 6.49 million sales per year, with sales declining every month since and ending August at an annualized rate of 4.8 million sales.
The national average 30-year mortgage rate increased from 3.3 percent at the start of the year to just over 7 percent in September. In the intermediate to long run, the slowdown in housing sales should help support the Fed’s attempts to combat inflation, but housing is currently a significant contributor.
Even though the housing sector was weak, the rest of the economy showed signs of growth. More jobs than were expected were added in July and August. Job openings are plentiful and the unemployment rate remained well below historical averages.
August saw solid retail sales and personal spending growth, with retail sales above economist estimates. The Conference Board Consumer Confidence survey for September showed consumer confidence at its highest level since April.
Business spending and confidence also showed signs of improvement last quarter. The ISM Services index indicated that service sector confidence increased in August to its highest level since April, and manufacturer confidence remained in expansionary territory during the month and quarter.
Core durable goods orders increased in both July and August, marking six consecutive months with increased orders. As you can see in Figure 1, core durable goods orders have been solid most of the year, even if the pace of growth has slowed.
Figure 1. Manufacturers’ New Orders: Durable Goods Excluding Transportation, 2021–2022
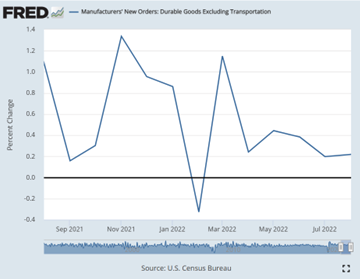
Source: U.S. Census Bureau
Overall, while there are signs that the Fed’s higher rates are starting to slow growth, with housing being the best example, the economy as a whole continues to expand.
Market Risks Remain Despite Growth
Even though the economy continues to grow, there are still very real risks to markets. Short-term market performance can be heavily impacted by other factors. While we’ve likely seen the worst impact from rising rates and high inflation on markets, it’s possible inflation will remain stubbornly high at year-end. The Fed’s restrictive monetary policy is also expected to continue slowing economic activity.
Beyond economic risks, the rest of this year also has political concerns. The U.S. November mid-term elections could see one or both chambers of Congress switching control, in addition to important state and local elections. There are also political risks abroad, including the continued Russian invasion of Ukraine and the general slowdown in global economic growth.
We’ve seen signs that inflation may be starting to slow and there is hope that the recent market pain has set investors up for better times ahead. Historically, periods with sustained sell-offs led to strong market returns. Despite short-term risks, the long-term picture is more encouraging.
Given the risks and potential for additional short-term shocks, a well-diversified portfolio that matches investor goals and timelines remains the best path forward for most. As always, you should reach out to your financial advisor to discuss your current plan if you have concerns.
Disclosure: Certain sections of this commentary contain forward-looking statements based on our reasonable expectations, estimates, projections, and assumptions. Forward-looking statements are not guarantees of future performance and involve certain risks and uncertainties, which are difficult to predict. Past performance is not indicative of future results. Diversification does not assure a profit or protect against loss in declining markets. All indices are unmanaged and investors cannot invest directly into an index. The Dow Jones Industrial Average is a price-weighted average of 30 actively traded blue-chip stocks. The S&P 500 Index is a broad-based measurement of changes in stock market conditions based on the average performance of 500 widely held common stocks. The Nasdaq Composite Index measures the performance of all issues listed in the Nasdaq Stock Market, except for rights, warrants, units, and convertible debentures. The MSCI EAFE Index is a float-adjusted market capitalization index designed to measure developed market equity performance, excluding the U.S. and Canada. The MSCI Emerging Markets Index is a market capitalization-weighted index composed of companies representative of the market structure of 26 emerging market countries in Europe, Latin America, and the Pacific Basin. It excludes closed markets and those shares in otherwise free markets that are not purchasable by foreigners. The Bloomberg Aggregate Bond Index is an unmanaged market value-weighted index representing securities that are SEC-registered, taxable, and dollar-denominated. It covers the U.S. investment-grade fixed-rate bond market, with index components for a combination of the Bloomberg government and corporate securities, mortgage-backed pass-through securities, and asset-backed securities. The Bloomberg U.S. Corporate High Yield Index covers the USD-denominated, non-investment-grade, fixed-rate, taxable corporate bond market. Securities are classified as high-yield if the middle rating of Moody’s, Fitch, and S&P is Ba1/BB+/BB+ or below.
Authored by Brad McMillan, CFA®, CAIA, MAI, managing principal, chief investment officer, and Sam Millette, manager, fixed income, at Commonwealth Financial Network®.
© 2022 Commonwealth Financial Network®
Smalley Investments is located at 213 E. St. Joseph Street, Lansing, Michigan and can be reached at 517-487-4850. Securities and advisory services offered through Commonwealth Financial Network, member FINRA/SIPC, a Registered Investment Adviser.